3.89 M
TEU in 2025
Explore the scale, composition, geography and historical evolution of Manzanillo's trade activity through measurable evidence.
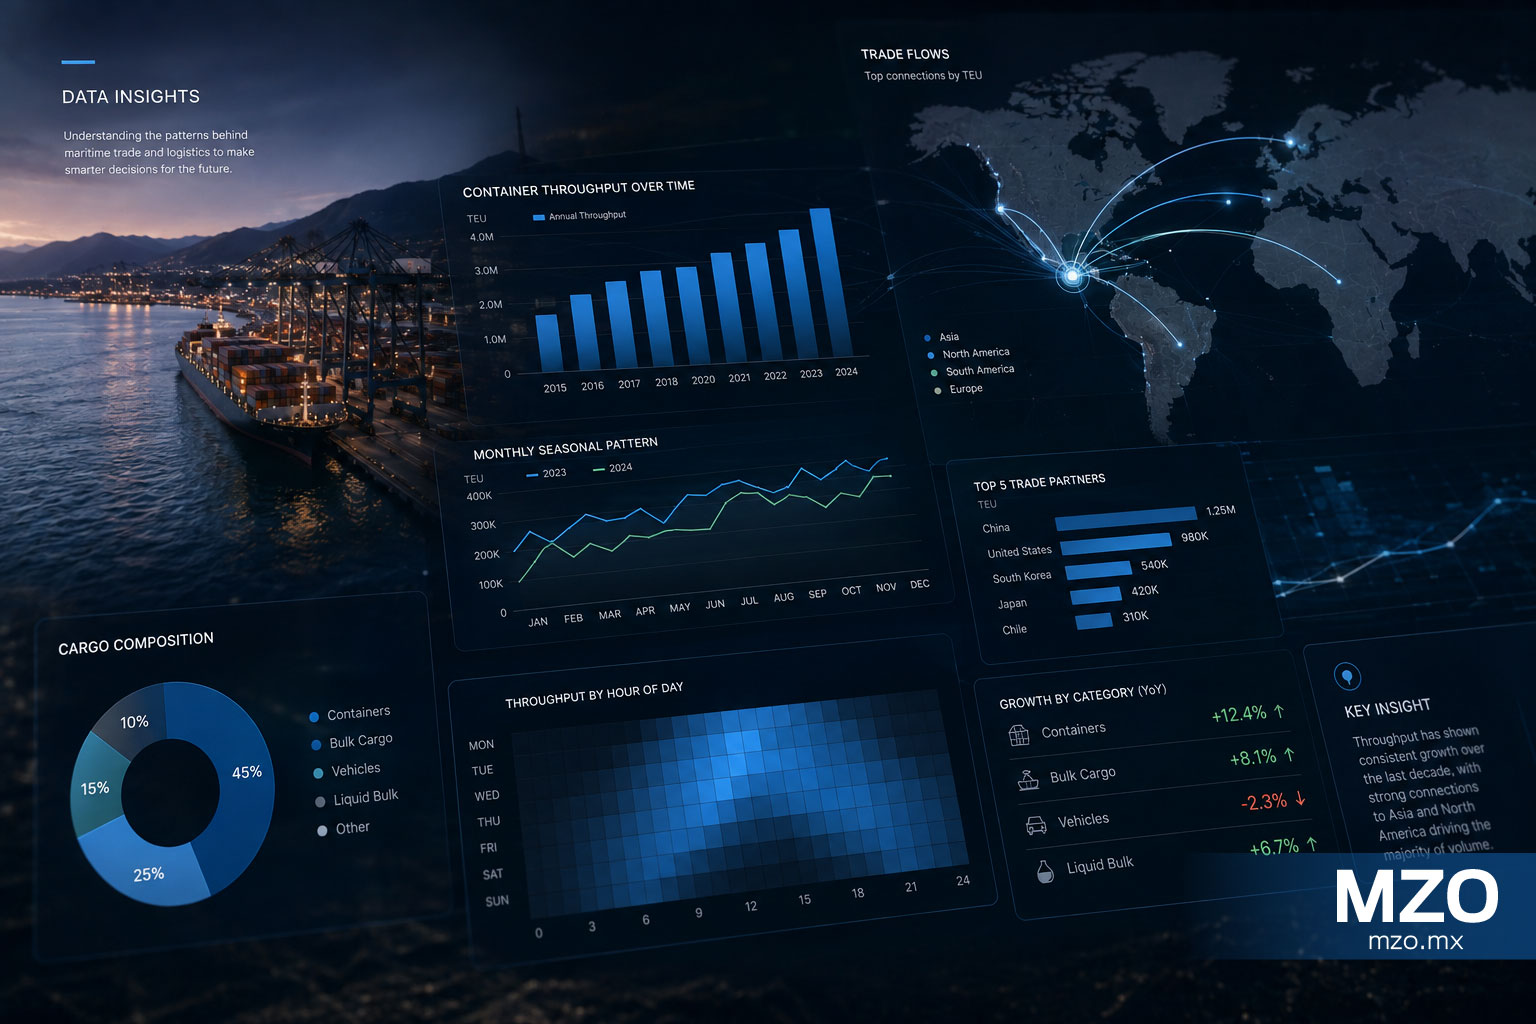
This report is part of the MZO Intelligence platform and presents an editorial analysis based on regional context, public information and strategic interpretation.
Manzanillo's trade system can be observed through several complementary measurements. Container activity describes the movement of containers through the port, while import and export volumes provide a physical measure of international trade. Cargo composition, trade geography and historical series add further dimensions to the picture.
The port handled 3,893,357 TEU in 2025, providing a measure of overall container activity.
International trade volume reached 26.66 million tonnes when import and export cargo are considered together.
Containerized cargo represented approximately 74% of non-petroleum cargo movement in 2025.
The annual container series shows substantial expansion since 2019, while 2025 remained slightly below the 2024 peak.
Four indicators provide a concise view of the scale, structure and evolution of Manzanillo's measurable trade activity.
TEU in 2025
Tonnes of international trade
Non-petroleum cargo containerized
TEU growth since 2019
Sources: ASIPONA Manzanillo. International trade volume refers to import and export cargo; cargo composition excludes petroleum products.
Import and export cargo provide the physical measure used to describe Manzanillo's port-associated international trade. In 2025, imports accounted for 21.14 million tonnes and exports for 5.53 million tonnes, for a combined international trade volume of 26.66 million tonnes.
Manzanillo recorded 21.14 million tonnes of import cargo in 2025, representing the larger share of the port's measured international trade volume.
Export cargo reached 5.53 million tonnes in 2025, providing the second component of the international trade volume measure.
Combined import and export cargo reached 26.66 million tonnes in 2025. Transshipment and cabotage are excluded from this measure.
ANAM provides a complementary customs-based measure through the value of foreign-trade operations at the Manzanillo customs gateway. This monetary indicator remains separate from ASIPONA's physical cargo measurements.
The composition of non-petroleum cargo in 2025 shows a system strongly oriented toward containerized movement, alongside mineral bulk, agricultural bulk and general cargo.
22.05 million tonnes, representing approximately 74% of non-petroleum cargo movement in 2025.
4.41 million tonnes, representing approximately 14.8% of non-petroleum cargo movement.
1.73 million tonnes, representing approximately 5.8% of non-petroleum cargo movement.
1.63 million tonnes, representing approximately 5.5% of non-petroleum cargo movement.
Historical port-specific evidence provides a view of the countries connected to Manzanillo's international trade through import origins and export destinations. These observations describe historical trade geography and should not be interpreted as current 2026 country shares.
Countries of origin associated with Manzanillo's import trade, measured through published cargo volumes and participation shares.
Countries of destination associated with Manzanillo's export trade, measured through published cargo volumes and participation shares.
Annual container activity increased substantially between 2019 and 2025, rising from 3.07 million TEU to 3.89 million TEU. The series reached its highest recorded level in 2024 before easing slightly in 2025.
Annual container activity increased by approximately 26.9% between 2019 and 2025.
Container activity reached the lowest point in the series at 2.91 million TEU.
The series reached its highest recorded annual level at 3.92 million TEU.
Activity remained close to the previous year's peak at 3.89 million TEU, approximately 0.8% below the 2024 level.
Manzanillo's trade system cannot be reduced to a single indicator. Container activity shows the scale of movement through the port, while import and export volumes provide a physical measure of international trade. Cargo composition reveals what is being moved, historical trade geography shows where the system was connected, and the annual series places current activity in context. Together, these measurements provide a more precise foundation for understanding the gateway through data.
Primary sources and references supporting this report.
ASIPONA Manzanillo
Port Statistics — January–December 2025
2025
ASIPONA Manzanillo
Port Development Program — Trade Geography
2019
ANAM
Foreign Trade Statistics
2025
Continue exploring regional datasets, indicators and visual analysis of the Port of Manzanillo.
Browse regional datasets
Data